Chapter 2 Questionnaire Construction: The Fundamentals
The focus of this chapter is on the technical issues of constructing a survey. I found this lesson to be more of a struggle to prepare than I expected. Why? There is a great deal of lore about what increases response rates and participation. Yet, research over the years, has both supported, contradicted, or not addressed these claims. One example is where to include “sensitive items.” Historically, textbook authors have recommended that these should come last so that respondents would be engaged in the process and be more willing to complete the survey (Krathwohl, 2009; Rowley, 2014). Yet, research has shown that this has not held up in employee groups (Roberson & Sundstrom, 1990) nor among members of the National Association of Social Workers (Robert G. Green et al., 2000).
Given these contradictions, this lecture starts with the overall structure of a survey. The core of the lecture focuses on recent, evidence-based support for item-level decisions. I briefly discuss construct-specific guidance and discuss specific considerations for the on-line environment. I then close by addressing some of the decisions that I routinely make in survey construction and provide my rationale for why. Because this lesson occurs at the beginning of a text on psychometrics – this “skips over and around” reliability and validity. These important issues will be addressed in subsequent lessons.
2.2 Components of the Questionnaire
Let’s start by examining the components of a questionnaire and the general guidelines for their construction(Colton & Covert, 2015; Pershing & Pershing, 2001):
Title
- reflect the content of the instrument
- be concisely worded
- be written in language easily understood by the respondents
- should not be offensive or off-putting
- should be formatted clearly at the top/beginning of the document
Introductory Statement
- include a brief summary of the instrument’s purpose
- contain an appropriate statement concerning the confidentiality of the respondent’s information (informed consent)
- be motivating such that respondents are inspired/willing to complete the items
- specify the approximate amount of time required to complete the instrument
Directions
- complete, unambiguous, concise
- written at a language level appropriate to the respondents
- tell the respondents how to return the instrument once they have completed it (surprisingly, in Qualtrics, this is also important; submission requires hitting that last little “–>>”)
Items
- discussed throughout this textbook
Closing Statement
- thank the participants for their participation
- remind participants that their information is valuable and perhaps remind about
- next steps or follow-up
- confidentiality
Overall Structure/Look
- should be coherent with an easy-to-follow layout
- professional appearance
- not crowded, plenty of white space
- avoiding a “slick look”
- numbering and headings to provide a sense of progress
- breaks between every 4-6 questions (or shading alternate items)
- in a sense, inviting and “easy on the eye”
Pershing and Pershing (2001) reviewed 50 reactionnaires (i.e., like “questionnaires” specifically intended to collect reactions) that were used by training evaluators at a “prestigious medical school.” Their purpose was to determine the degree to which the survey design adhered to the recommendations. The results suggested that:
- 72% did not include an introductory statement; an additional 16% were “minimal”
- 78% had no closing statement
- 30% had no directions; another 54% of directions were “minimal”
- 8% were professional in appearance
In summary, the formatting of the reactionnaires were not designed in a way that would maximize respondent engagement. In turn, we might expect this to threaten the psychometric reliability and validity.
2.3 What Improves (or Threatens) Response Rates and Bias?
When we design survey instruments based on our own preference rather than research-based evidence, we may get less than optimal data. Chyung et al. (2018) reviewed the five steps (Schwarz & Oyserman, 2001) that survey respondents engage when answering structured, closed-ended survey items.
- Interpreting the question.
- Retrieving information from their memory.
- Integrating the retrieved information with the item prompt.
- Selecting one of the given response options.
- Editing the answer for reasons of social desirability.
Chyung and colleagues appear to be starting such a systematic review. What follows are their evidence-based evaluations regarding some of the most common questions about questionnaire construction.
2.3.1 Should Likert-type scales include a midpoint?
Likert-type scales, named after Rensis Likert, include a set of questions or statements that can be responded to with a consistent set of response options. The response options are frequently scaled with intensity options ranging from 2 to 11; four and five point “agreement” scales str shown below. There are many variants of response options (i.e., frequency, like me, degree of stressfulness). Regarding the issue of a midpoint (“neutral” or “neither disagree nor agree”), Chyung et al. (2017) reviewed the literature. Examining their article, we can see variants of Likert-style scaling for a scale of agreement. They look something like this:
| Type | |||||
|---|---|---|---|---|---|
| No midpoint (4 pt.) | Strongly Disagree | Disagree | skipped | Agree | Strongly Agree |
| Midpoint (5 pt.) | Strongly Disagree | Disagree | Neither Disagree nor Agree | Agree | Strongly Agree |
Chyung and colleagues quickly suggest that the question is not “Should I use a midpoint?” but rather “When should I use a midpoint?”
The article is more detailed, but essentially, a midpoint is appropriate when:
- the measurement scale is interval (instead of ordinal; this is a good statistical property to have)
- the question content is such that the midpoint is a true midpoint and not a point for hedging or avoiding
If a true midpoint is impossible, then consider adding an option such as “I don’t know” or “It depends.” If the “I don’t know” option is used, the researcher needs a plan for recoding the data as missing and having a plan for managing missingness
2.3.2 Should continuous rating scales be used in surveys?
First, let’s consider the distinction between discrete, continuous, and numerical scales. Figure 4 in the Chyung, Swanson, Roberts, and Hankinson (2018) article illustrate the major differences and some variations.
- Discrete scales are Likert-type scales that range between 2 and 11 discrete options. Classically, respondents pick words (e.g., pain rated as no pain, mild, moderate, severe, extreme, worst pain possible).
- Six-point discrete rating scales result in a collection of six ordered values.
- The measurement scale for discrete scales is ordinal.
- Ordinal scales should be analyzed with non-parametric statistical procedures, however parametric approaches can be used if the data are normally distributed and there is a mid-point.
- Continuous scales allow respondents to indicate a response anywhere within a given range – usually by marking a place on a horizontal line on a continuum of a minimum of 100 points. There are no discrete categories defined by words or numbers.
- Continuous scales result in precise numbers (e.g., 26 or 26.8 if the scale is 0 to 100).
- The measurement scale for continuous scales is interval.
- Interval scales can be evaluated with parametric statistics.
- Visual analog scales (VAS; aka graphic rating scales, GRS) are another variant of continuous rating scales if they allow the participants to make “anywhere on the line.” Some VAS scales have verbal descriptors to guide the marking; some have numbers (hence, numerical response scales). In Qualtrics there is a slider option that serves this function.
Which is better? The mixed results are summarized in Chyung et al’s (2018) Table 1. With a focus on the types of research I encounter in my program, here is my take-away:
- Continuous scales provide better data (i.e., more precise/full information, more likely to be normally distributed, better reliability) for statistical analysis.
- Caveat: If the response scale on a Likert scale is increased to 11, there is a better chance to have normally distributed responses.
- Caveat: When “simple descriptive statistics” are desired (e.g., histograms, frequency distributions) the discrete scale may be the best choice.
- Discrete and continuous options (including sliders) are easy to use, except in the case where respondents complete the surveys on mobile devices.
- Caveat: There has been more missing data with sliders (compared to radio buttons).
- Caveat: Respondents are more likely to change their responses on sliders. If this means there is greater accuracy or more careful responding, this is desirable.
- In both circumstances adding “don’t know,” “prefer not to respond,” or “not applicable” may improve the validity of the responses.
- Caveat: When using one of these response options, plan ahead for coding as missing and managing the missingness.
2.3.3 Should Likert-type response options use an ascending or descending order?
Let’s first look at the difference between ascending and descending order (Chyung, Kennedy, et al., 2018):
| Type | |||||
|---|---|---|---|---|---|
| Ascending | Strongly Disagree | Disagree | Neither Disagree nor Agree | Agree | Strongly Agree |
| Descending | Strongly Agree | Agree | Neither Agree nor Disagree | Disagree | Strongly Disagree |
In the consideration of the choice between ascending/descending, we are concerned with response-order effects. Let’s first examine these conceptually/theoretically.
Recency effect is the tendency of survey respondents to select the options that they see at the end of the response-option list. This is expected when options are presented orally (e.g., during interviews, people tend to choose from the last-offered options).
Primacy effect is the survey respondents’ tendency to select the options that are presented at the beginning of the response-option list. This is expected when options are presented visually. For example, people tend to choose among the first-presented categories in self-administered written survey questionnaires.
- Left-sided selection bias occurs when respondents read text from left-to-right and are more inclined to select options from the left.
- Satisficing theory occurs when individuals seek solutions that are “simply satisfactory” so as to minimize psychological costs. Thus, respondents may
- select the first option that seems “reasonable enough”,
- select the “I don’t know” response, or
- randomly select one of the options.
- Acquiescence bias is the tendency for respondents to agree with the statement provided—aka yea-saying bias (e.g., being polite).
- Closely related is social-desirability bias, the tendency for respondents to select among the options they think are more socially acceptable or desirable (instead of true responses).
- In surveys, this generally is selecting agree or strongly agree.
Considering these response biases together, Chyung et al. suggest that when the response options are presented in descending order (Strongly agree, Agree, Neutral, Disagree, Strongly disagree), respondents would (theoretically) see a positive option immediately on the left side of the response scale and perceive it to be socially desirable and satisfactory. As a result, they may to select it without having to spend more time to choose a more accurate response. After reviewing 13 studies, Chyung et al. observed that many studies (paper and web based, with children and adults, in English and other language):
- Revealed response-order effects in self-administered surveys, especially the primacy effect, associated with left-side selection bias, acquiescence bias, and satisficing.
- Showed more positive average scores from descending-ordered scales.
Recommendations:
- Present response scales in ascending order.
- When a number line is used, lower and negative numbers should be on the left.
- When using descended order scales:
- keep respondents motivated to complete items accurately,
- present half items with descended-ordered scales and the other half with ascended-ordered scales,
- assign half of participants with descended-ordered scales; half with ascended-ordered scales, and
- present response options vertically rather than horizontally.
2.3.4 Should surveys include negatively worded items?
In examining this question, Chyung et al. (Chyung, Swanson, et al., 2018) made a distinction between (see Table 1 in the article):
- Statement format with a consistent response scale (e.g., strongly disagree to strongly agree).
- Question format with variable response scales that are tailored to individual survey questions.
- A challenge with this format is the difficulty in calculating an average score of data obtained from multiple survey items.
The advent of negatively worded items began with Rensis Likert in 1932. He was an American social psychologist who, in attempt to mitigate acquiescence/yea-saying biases, recommended designing one half of survey items to be associated with agreement and the other half with disagreement. Although Likert recommended “straightforward statements,” incorporating negative words can become quickly complicated. Table 2 in the Chyung paper shows that there are four ways of wording survey statements:
Reverse-coding, which is necessary when including negatively worded items in a scale, assumes that agreeing to a positively worded statement and disagreeing to its negatively worded counterpart are the same. Tables 3 and 4 in the Chyung et al., manuscript (2018) show how this assumption may be faulty. A review of the negatively-worded-item literature suggested the following:
- Scales with all positively worded items yielded greater accuracy when compared with all negatively worded items or mixed worded items.
- Scores on positively and negatively worded items are not the same (e.g., strongly disagreeing to a positively worded statement is different from strongly agreeing to a negatively worded statement)
- Positively worded items produce higher means than negatively worded items. This may be due to
- carelessness and fatigue in reading items,
- the cognitive processing of positive and negative items may be different.
- A method factor has shown itself where exploratory approaches to factor analysis have produced separate factors with the negatively worded (or otherwise ambiguous) items creating their own factor. This results in a threat to construct validity and reliability.
Chyung, Barkin, and Ramsey (2018) noted that respondent performance declines approximately 12 minutes after starting a survey. It appears that respondents increasingly fail to notice negatively worded statements even when there are efforts to draw their attention to them via bolding, underlining, or capitalizing the negated element (e.g., not). Thus, when negatively worded items are used, they should probably be presented early in the protocol.
Chyung et al (2018) also cautioned about a response set bias that can occur when using all positively worded items. They recommended making design choices that enhance bias-free and accurate responding based on the research design.
- For example, attributes to be measured in some constructs (e.g., depression, anxiety) are, themselves, negative and so a negatively worded item may be most clear and appropriate.
- The inclusion (and subsequent analysis) of negatively phrased items may help detect acquiescence bias.
- Table 5 in the Chyung et al (2018) manuscript provides some guidelines that are more nuanced when negative items must be included. For example,
- Ensure that negatively worded items are true polar opposites and symmetrical (so they can be analyzed with the positively worded items).
- Group negative items together (and forewarn/format so they are recognized as such).
- Administer the survey when respondents are not fatigued.
- Analyze the effect of the negatively worded items.
2.4 Construct-specific guidance
Across disciplines and constructs, there may be localized guidance. One domain-specific example is self-efficacy. In this case, construct-specific guidance addresses both the (a) content of the items and (b) formatting of the scales. Regrading content, even though there are some general self-efficacy scales Bandura’s original definition suggests that scales and their items should be task specific (i.e., career decision-making self-efficacy, math self-efficacy). Further, Bandura (2006), recommended the following for self-efficacy scales:
- Phrase items as “can do” rather than “will do.”
- Maintain consistency with the self-efficacy construct definition (e.g., domain specific, a focus on capability rather than self-worth).
- Include items that reflect gradations of challenge.
- Ask individuals to rate their current (as opposed to future) operative capabilities.
- Use 100-point continuous scaling.
2.5 Surveying in the Online Environment
Nearly a decade ago, a survey of human subjects review boards suggested that 94% of the IRB applications reviewed involved online or Web-based surveys (Buchanan & Hvizdak, 2009). Thus, it is important to understand the online environment. A first set of considerations involve data security, identity, and permission (implicit and explicit).
The IP address as well as longitude/latitude has been a contentious issue for a number of years (Buchanan & Hvizdak, 2009). EU data protection laws consider IP addresses as personally identifiable data; in the U.S., IP addresses typically fall outside the definition of “personal information.” In Qualtrics, the default is to collect and download the IP address (the “anonymize response” option can prevent this data from being collected). On the one hand it is helpful to know geographically “from where” participants are responding; on the other, some consider its capture to be a violation of privacy. Relatedly, paradata and metadata are data such as typing speed, changed answers, response times, and time spent on the survey. For both geolocation and paradata/metadata, a strong consideration is fully informed consent (Schober & Conrad, 2007). Is it ethical to capture this information without explicitly saying so? A best practice is to provide complete descriptions of what data is being collected and provide a rationale (in the IRB application, if not directly in the informed consent) for why it is necessary. Survey tools like Qualtrics have strong options for anonymizing data (i.e., permanently deleting identifying information). If this option is being used, this information should be included in the informed consent (and, perhaps, recruiting materials).
The specific survey tool being used should be evaluated. Buchanan and Hvizdak (2009) argued that until each tool is vetted and its privacy policies and data security policies are understood, we cannot be certain how security, consent, and privacy are operationalized within the individual tools. For example, it is possible that tool creators could gather respondent data and repurpose it for their own marketing, for sale to other researchers, and so forth.
Online and web-based protocols increase our reach geographically and cross-culturally. A first impression might be that the online environment increases access (Schober & Conrad, 2007). We should probably think twice about this presumption. Consider the decades of psychological research based on White, college-educated, males. Does the online environment create another strata of privileged research with technology that may not be accessible in terms of both internet/technology as well as capacity/fluency with the tool? Additionally, does the way that the survey is promoted result in invitations that only occur within certain segments of the internet? If so, the results may not be representative. On the other hand, what are the risks of not adopting new technologies before everyone has them. Another consideration is cultural and language translation. These issues are addressed more completely in the lesson on invariance testing.
When paper/pencil measures were administered in face-to-face settings (individually or in auditoriums of students) there was some degree of a standardized protocol. This is lost when surveys are administered online. Further, we cannot guarantee who is taking the survey. Increasingly, when surveys are offered through fee-based programs like mTurk and Prolific, bots have been trained to take the surveys and receive the incentive. Survey programs like Qualtrics now offer additional packages to help with security and bot-prevention. It is probably also wise to add attention-check items (e.g., “This is an attention check. Please answer ‘3’.”). Another option is to include a final question that asks the respondent to ensure the integrity of the response. An example last item might be, “To what degree is the statement below true of you: I read each question/item and provided answers that were true for me.” The scaling for this item was a 100-point slider with “Untrue,” “Neither true or untrue,” and “True”.
When respondents are remote, what happens if they have a negative reaction to the survey? In a face-to-face context, debriefings can occur, and referrals can be made. IRB committees are likely to consider the degree to which surveys may be upsetting and require resources for referral and assistance in the case of an adverse event.
Security of test items might also be concerning. It is inappropriate to use proprietary items without the permission of its author. If the security of items is important (e.g., SAT/GRE, intelligence test items, inkblots) because they are central to administration, how can they be protected in the virtual environment?
Consequently, when students in our programs write doctoral dissertations they are to include the following in their Method section.
- Describe how informed consent will be obtained in the online environment.
- Describe the level of identification that is collected. If the claim of “anonymous” or “de-identified” indicate whether/not this includes capturing the IP address; some researchers believe that capturing a computer’s IP address threatens anonymity.
- Describe the steps to be taken to ensure that respondents met the inclusion/exclusion criteria of the study.
- Anticipate and describe how the online (e.g., uncontrolled, public, distractions) setting might affect responses.
- Particularly if the survey contained sensitive materials, describe how respondents might access resources for debriefing or referral.
- Identify the permissions (from original authors or copyright holders) granted to reformat and post (on the internet) existing surveys. If items are considered to be secure (e.g., those on the MMPI or WAIS), identify steps taken to protect them.
2.6 In my Surveys
Because there isn’t empirical data on every decision that we make in survey construction, I thought it might be useful for me to address some of the decisions that I find myself making in the online surveys I use in my own research.
2.6.1 Demographics and Background Information
A core value that I hope to reflect in the ReCentering Psych Stats series is to promote socially and culturally responsive research. Correspondingly, the information we collect from participants should ensure that they feel that their identities are authentically reflected in the survey. Naively, when I first considered how to capture race/ethnicity in my surveys, I looked to the categories used in the U.S. Census. Immediately, I learned that this is problematic. Rather than elaborating here, I invite you to take a listen to NPR’s Code Switch podcast. Two of the episodes review how the assessment of race and ethnicity has evolved and explain why it is problematic: Census Watch 2020 and The U.S. Census and Our Sense of Us. As made clear in the Code Switch podcasts, the assessment of race and ethnicity in the U.S. Census erases people when their identities are not included.
My last few surveys have captured race/ethnicity data differently. Each time, I engage in several practices that (I hope) will continue to shape the item in a socially and culturally responsive way. Systematically, I:
- conduct a quick internet search to see if there is an emerging best practice (even though I may have also searched weeks or months prior),
- consider who the intended research population is in relationship to the topic of investigation,
- look to recently published, similar, research to see what other researchers are doing, and
- ask for a collegial, formative review from individuals who hold marginalized identities, whose data will be requested in the survey.
When I engage in research, I try to balance the need to quantify (with discrete categories) who is participating in the survey and inviting respondents to state (in their own words) their identity. This is consistent with my view that variables like race, ethnicity, and gender identity are socially constructed. In addition to this particular worldview, Parent (2013) has suggested that the worst possible kind of missing data pattern (MNAR – missing not at random) may be caused when items are unanswerable to particular person. Therefore, it is essential that all individuals recognize themselves in the items that assess demographic variables.
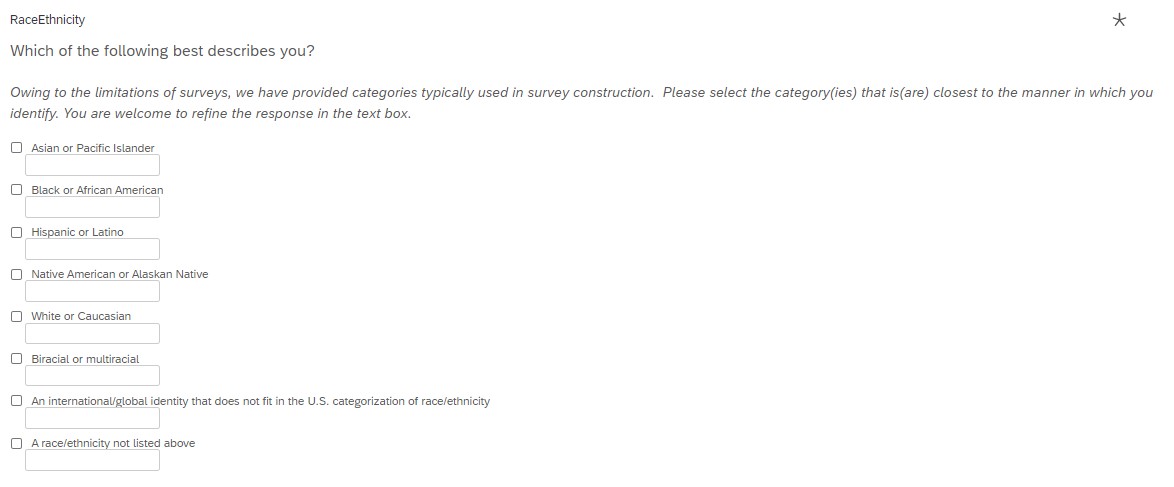
A recent survey of mine was directed toward community members (including students, alumni, staff, faculty) of my predominantly White, liberal arts, Christian institution. After reviewing recently published research articles and consulting with a handful of individuals, I chose to include the following categories – each with a text write-in box so that individuals could select the category(ies) that fit best and have the opportunity to refine it(them). I am excited to review this data because such responses may inform my next survey. The categories included:
- Asian or Pacific Islander
- Black or African American
- Hispanic or Latino
- Native American or Alaskan Native
- White or Caucasian
- Biracial or multiracial
- An international/global identity that does not fit in the U.S. categorization of race/ethnicity
- A race/ethnicity not listed above
Respondents could select multiple categories. Additionally, they could write in an identity that better aligned with their self-understanding.
The option to select multiple boxes results in some extra coding when preparing the data for analysis. I am taking approach that we will listen to the data and decide, based on the results, how to report the findings in a way that will efficiently fit into an APA style empirical paper and honor the respondents.
The population of interest for this particular study are those who are engaged in protest activities regarding hiring practices and policies that result in discrimination to members of the LGBTQIA+ community. This means that questions of gender identity, pronouns, and relationship to the LGBTQIA+ community are important to the research and need to be asked sensitively and with great security of the data.
Regarding gender identity, I used a similar approach, allowing individuals to select multiple categories and offering write-in boxes for each. The categories included:
- female
- male
- nonbinary
- trans woman
- trans man
- another identity (with a write-in box)
- prefer not to say
Additionally, I invited individuals to identify their pronouns. Again, write-in boxes were offered with each option.
- they/them/theirs
- she/her/hers
- he/him/his
- they/she/he
- neo pronouns (e.g., xe/xem/xyr, ze/hir/hirs, ey/em/eir)
- another identity (with a write-in box)
Finally, we wanted individuals to indicate their relationship to the LGBTQIA+ community. We asked them to select all that apply. Only the “something else” box had a write-in option:
- Member
- Exploring/Questioning
- Ally
- Not related
- Something else (with a write-in box)
I expect that my future surveys may inquire about these variables differently. If you have found a different way to ask, please consider e-mailing me. I would love to provide different options and give credit to contributors.
2.6.2 Survey Order
Historically, demographic information has been first or last in the survey. Although some research has reported no differences in response rates when demographic and sensitive data are at the beginning or end (Krathwohl, 2009; Rowley, 2014), I am inclined to open the survey with questionnaire items that are closely related to the topic listed on the recruitment materials and end the survey with the demographic information. Why? It makes sense to me that if someone has responded positively to the survey topic, they expect to answer questions (right away) about that topic.
In between that opening survey and closing demographic items, I consider if there are any order effects that would engage in undue priming of responses. If there are such concerns, I think through the order to minimize these biasing effects. If there are no such concerns, I put my surveys in blocks and then ask my survey program to randomly present the blocks. This serves two purposes:
- counterbalancing possible order effects, and
- distributing missingness for individuals who do not complete the survey.
2.6.3 Forced Responses
Programs like Qualtrics are able to engage in a variety of content validation procedures. If these are in place, they may require the person to enter a properly formatted response (e.g., phone number, e-mail address, numerical response between 0 and 100) before responding. These are extremely helpful tools in collecting data that will be closest-to-being-ready-for-analysis. These same procedures can force or request a response.
Requiring a response is tempting. However, doing so violates IRB requirements that allow a person to skip or “quit at any time without penalty.” They may also anger a person such that they stop responding. Some researchers get around this by requiring the response but including a “Not applicable” or “Prefer to not answer” column. Because I worry that (a) the respondent may confuse that option with one extreme of the scale and/or (b) my research team and I will forget to code it as missing data, I prefer the request response alternative.
In Qualtrics in particular, I turn on the “Request response” feature for each of the questions. If an item is skipped, a simple warning is displayed that invites the respondent to review the page of answers to see if they would like to answer the question. If not, they can simply move forward.
2.7 Practice Problems
In each of these lessons I provide suggestions for practice that allow you to select one or more problems that are graded in difficulty. With each of these options I encourage you to:
This is a two-part lesson on questionnaire construction. After the second lesson, a detailed suggestion for practice will be provided that lists criteria for creating and piloting a survey of your own.