Chapter 2 Formatting the Book
In this lesson I review the formatting tools and conventions that I use most often. This is not an exhaustive list of formatting tools, just the ones that have been useful in the ReCentering Psych Stats project. If you haven’t found them already, do check out the two regularly updated official documentation for using R Markdown with bookdown (Xie, 2021; Xie et al., 2021).
The bookdown project has a very specific file structure. The index.Rmd file must be first and must have that exact name (i.e., “index.Rmd”). The files that follow should be numbered in the order in which you want them to appear. While you may wish to give each chapter its unique number, the bookdown packages numbers the chapters by the single hashtag – skipping over any that have the dash (enclosed in squiggly parentheses). That is, the numbers associated with each of the .Rmd files may not correspond with chapter numbers unless you have carefully hashtagged out some of the single hashtags.
Let’s start by exploring the index.Rmd
2.1 The YAML matter atop the index.Rmd
The material at the top of the index.Rmd is often called “yaml matter” (“Yet Another Markup Language”) and provides instructions for how the document is to be rendered. These instructions appear between three dashed lines before and after the YAML header.
In decoding what is and is not necessary in my YAML header (and learning what each command does), I have often visited other open source documents such as Dougherty’s (2021) On the Line and Navarro’s (2020) Learning Statistics with R which are both available GitHub (the links are to their GitHub repos). The text below is what is in the YAML of this index.
The sections of highlighted text below are copied directly from the YAML header in this mini-volume. Most of it will seem self-explanatory. However, I offer brief explanations following sections of the script. If you access the .rmd file itself, I left left some of these clues using by commenting them out with hashtags.
title: "ReCentering Psych Stats: extRas"
author: "Lynette H. Bikos, PhD, ABPP"
date: "`r format (Sys.Date(), '%d %b %Y')`"
Title and date are likely obvious. When the date, entered following “r” (using the format: `r `) the date at the time of the knit or build will auto-update, like this: 06 Dec 2021. As might be obvious from the “format” and “%d %b %Y” code, the date can be presented in a variety of structures. More instructions are available in the R Markdown Cookbook (Xie et al., 2021).
site: bookdown::bookdown_site
documentclass: book
The site and document class commands (and their settings) are the defaults in the bookdown template. They allow RStudio to recognize the directory as a book source directory and it will add the “Build Book” button in the “Build” pane (Xie et al., 2021).
citation-style: apa-single-spaced.csl #
bibliography: STATSnMETH.bib
link-citations: yes
There are a variety of citation styles. I changed the default to the style for the 7th edition of the APA Style Manual. You will need to download this style sheet and put a copy in the project folder. Of course you can copy and use mine, or you can obtain a fresh copy at the Zotero Style Repository. There you can find more than 10,000 styles – including at least eight versions of the 7th edition of the APA Style manual!
The style sheet is essential if you include references. I use Zotero and ensure that all the references that I cite are included in a project-specific folder. From Zotero, I export (by right-clicking) that folder in the BibTex format (selecting “Export Notes”) to the project folder. Any time I add references or update the formatting of any of the Zotero entries, I must re-export the folder to my bookdown project folder and restart R. Your reference folder can have any name that you give it.
Finally, specifying “yes” to the “link-citations” command will render live links to the citations that Zotero (or your reference manager) provides.
All of these appear to be optional; the book will render without them. If you are not planning to use citations, you can hashtag them out (keeping them as placeholders for potential use later) or delete them altogether.
url: https://lhbikos.github.io/extRas/
cover-image: images/ReCenterPsychStats-extRas-bookcover.png
description: |
  "extRas" is a mini-volume in the ReCentering Psych Stats series that is devoted to some of the technical tools and processes used that just do not fit easily in the regular volumes (e.g., ANOVA, psychometrics, multivariate). The examples and instructions may be somewhat limiting in that they have a specific use-case for graduate students in psychology programs at our institution.
github-repo: lhbikos/extRas
The information provided in the url:, cover-image, description, and github-repo elements appears as metadata when its link is posted to the internet. The picture below is an example of how the metadata appeared when I posted a link to its GitHub Pages site to a chat in Microsoft TEAMS.
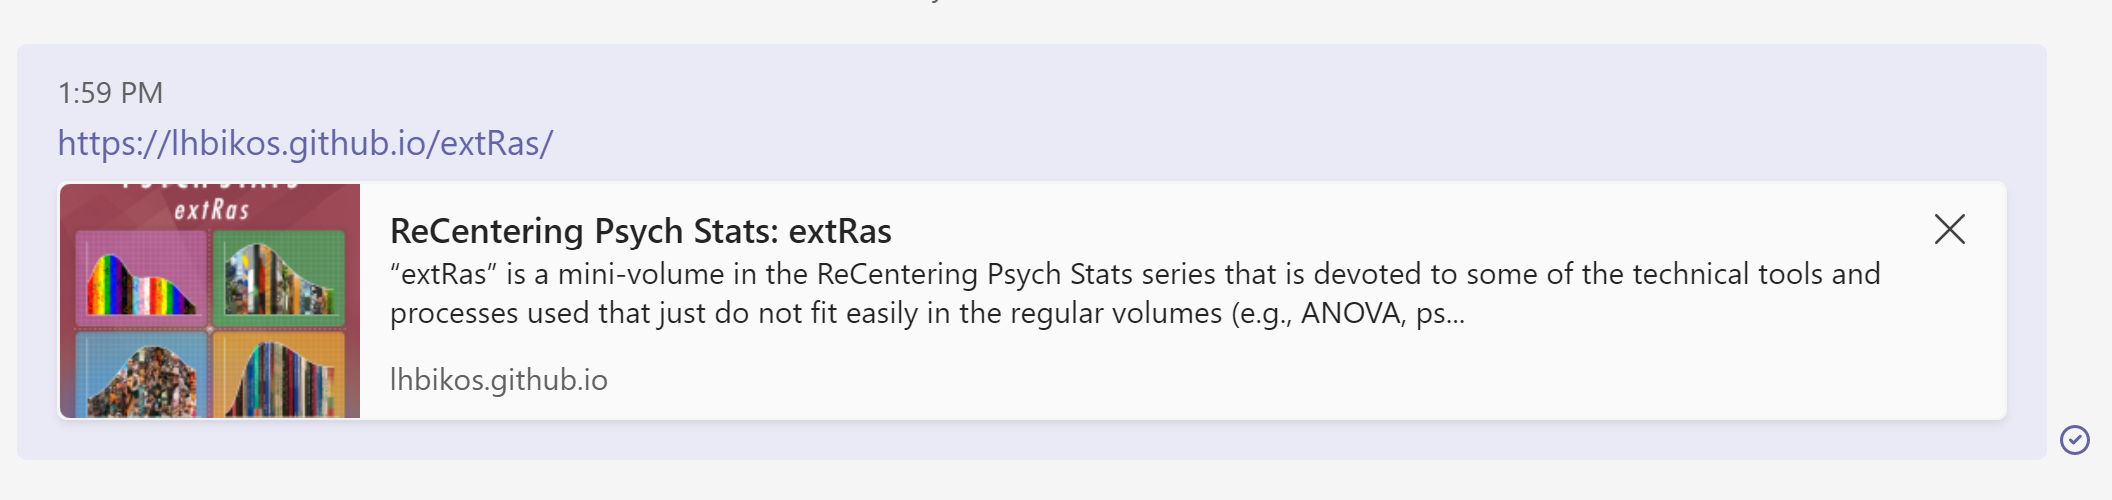
A screenshot of a Microsoft TEAMS message where the direct link, mini-description, cover-image, and link to the GitHub repository are displayed.
The book will build and post without these elements. You can either delete or hashtag them out. If you include the description, make sure to keep the pipe (|) that occurs immediately after the command.
2.2 My Go-To Formatting Tools
R Markdown and bookdown offer a number of options for formatting text. My purpose is to merely provide an introduction to the techniques that I have used most frequently in ReCentering Psych Stats. Not surprisingly, there are tremendous resources on the internet that provide instruction and examples. A helpful second stop beyond my resource is Chapter 5 (Formatting) of the R Markdown Cookbook (Xie et al., 2021) and Authoring Books with R Markdown (Xie et al., 2021).
2.2.1 Chapter numbering
Bookdown treats the single hashtag as a chapter and, by default (this can be changed) will number accordingly. I have used the index.Rmd to host a PREFACE and ACKNOWLEDGEMENTS I have sectioned these with a single hashtag, but because I added the “{-}” symbol, they are not treated as numbers and not included in the numbering system. An example of this is THE MECHANICS BEHIND RECENTERING section, which includes several chapters devoted to the integration of bookdown, GitHub, GitHub Pages. My own convention is to use ALL CAPS when I am including a significant section that is not considered to be a numbered chapter.
There needs to be a line space before and after each use of the chapter heading. If you would like to provide a nickname that you can use later to cross-reference back to this chapter or section, include a hashtag and nickname in the squiggly parentheses.
Subheadings are created by adding additional hashtags. Specificaly, two hashtags (##) is subordinate to the chapter level heading (we’ll call it the parent heading) and three hashtags (###) are the child-heading to the parent.
# UNNUMBERED CHAPTER HEADING {-}

# Chapter Heading Numbered with Cross-Reference Link {#chapterlink}

## Subheading (parent)

### Subheading (child)
Later, I can can provide a link that will cross-reference back to the [Chapter](#chapterlink).Here is a functional example linking back to the From bookdown to GitHub Pages chapter.
2.2.2 Bulleted and numbered lists
My understanding that when books are written for use on the internet short(er) paragraphs and lists can be helpful to the reader in that they reduce the cognitive load.
Bulleted lists can be specified with the ’*’ , ‘-’“‘, or’+’ signs, interchangeably. For no specific reason, I often use the asterisk for parent-level headings and a dash for child-level headings. A line space is required between the text above the first bullet.
If I am going to make a bulleted list I will start by leaving a space between the text and the first item in the list:

* Parent item 1
* Parent item 2
  - Child item 1
  - Child item 2
The rendered result is this. If I am going to make a bulleted list I will start by leaving a space between the text and the first item in the list:
- Parent item 1
- Parent item 2
- Child item 1
- Child item 2
At times you may wish to have numbered lists. The structure is the same.
If I am going to make a numbered list I will start by leaving a space between the text and the first item in the list:

1. Parent item 1
2. Parent item 2
   - Child item 1
   - Child item 2
The rendered result is this. If I am going to make a numbered list I will start by leaving a space between the text and the first item in the list:
- Parent item 1
- Parent item 2
- Child item 1
- Child item 2
2.2.3 Text emphasis
Emphasizing text can be helpful in conveying the meaning in the finished document. My understanding is that we should use the built-in systems (in the case of bookdown, using the # system for headings/subheadings) for the heading structure. This is so that text-readers will recognize and emphasize appropriately. I have also understood that underlining is discouraged because it may give the impression that there is a hyperlink. Therefore my go-to’s are italics and bold.
Italics is created by placing a single asterisk around the intended word or phrase; bold is created with a double asterisk around the word or phrase to be bolded. This sentence is demonstrated, below.
*Italics* is created by placing a single asterisk around the intended sired word or phrase; **bold** is created with a double asterisk around the word or phrase to be bolded.By now you may have noticed that the asterisk can be uses for bulleted lists, italics, and bold. Yes, there will be times when R will read the asterisks in a confusing way and you will need to think careful about the coding and how to order it.
There are times when I want emphasize something in the text with highlights rather than with italics or bold. This is possible by surrounding the words with tic (“`”) marks. This sentence is repeated below to demonstrate the different techniques.
There are times when I want emphasize something in the text with `highlights` rather than with *italics* (surrounding the tet in single asterisks) or **bold** (surrounding the text in double asterisks.If I want to highlight an entire section, I enter a code chunk and then in the chunk header write “r eval=FALSE.” The command, “eval=FALSE” means that R will simply print what is in the chunk, but not try to execute it. This results in the boxes of highlights that you see. Unfortunately, I have not figured out a way to show this in a highlighted box. Note that text does not wrap automatically in these chunks, this is why a slider appears on the bottom of some of these chunks. Returns (ENTER) can help with spacing if you prefer.
2.2.4 Adding images
Images can be critical in conveying important messages and I use them abundantly. My strategy has been to store an image in the project folder (usually in a chapter folder in an images folder in the project folder) and then call it with the code below. Note that the code allows for a figure caption. Another principle of universal design is to provide text captions.
Before uploading the imagine, I created a single image (from the four photos) and saved it as a .png. With very little sophistication, I used the Snip & Sketch app on my Windows machine and the picture tools in Microsoft Word. The photos were taken by Shari Young Kuchenbecker, PhD, and were part of the official post-convention collection that were posted at the WPA Convention Site. The story behind the photos is that my then-advisee, Desta Gebregiorgis (now Dr. Gebregiorgis), and I were receiving an awesome stats consult from the quantiative psychologist Jodie Ullman, PhD, a Professor at the California State University, San Bernardino. As evidenced in the increasingly perplexed facial expressions, it was complicated.

A four-photo series of thumbnails depicting three individuals sitting around a table trying to solve a statistics dilemma. The facial expressions become increasingly bewildered across the series.
2.2.5 Creating a table from within the .rmd file
Often times we will use packages to create, present, and imbed tables and figures as we conduct the statistical analysis. At other times, we may wish to create a table without an external dataset. I do this in nearly every ReCentering Psych Stats chapter when I create the grading rubric. At other times, I may create a table to facilitate comprehension of a statistical concept. Here is a the classic table used to convey the relationship between Type I and Type II error.
Here’s the code for producing the table (actually two distinct tables) that follows. The specification is simultaneously simple and complex. Several guidelines will help decode it.
- There should be a line space (e.g., a blank line) before each table, between table sections (if the table is composed of differeng numbers of columns), and after its conclusion.
- The first row of the table (as well as each table section) should mark out the different columns with pipes (
|) and column titles. Words in these rows will automaticaly appear in bold. In my table, the first column has no words and is left blank; the column heading, “Reality,” appears in the second column). - The second row of the table uses dashes to define each column’s width. Colons at the left, right, or both ends specify the justification of the cell content.
- The third and subsequent rows of the table include the content for each cell of the table.
You can see that my single Type I/II error table is composed of two distinct tables. Because my dashed-lines correspond, the two tables align perfectly in the rendered product.
|               |Reality                       |
|---------------|:----------------------------:|

| Your Findings |Ho True       |Ho False       |
|:--------------|:------------:|:-------------:|
|Ho True        |Correct       |Type II error  |
|Ho False       |Type I error  |Correct        |
The pretty table:
| Reality |
|---|
| Your Findings | Ho True | Ho False |
|---|---|---|
| Ho True | Correct | Type II error |
| Ho False | Type I error | Correct |
In a stacked table such as we have, the pipes in the rows with dashed lines must align. However, is not necessary for their to be perfect alignment of the pipes in the remaining rows. When there is length content there may even be overlap of rows.
Here is a second table to show that the pipes need not align to produce a perfect result.

|   |Reality |
|---------------|:----------------------------:|

| Your Findings |Ho True|Ho False |
|:--------------|:------------:|:-------------:|
|Ho True|Correct |Type II error |
|Ho False |Type I error |Correct |
Here is a second table to show that the pipes need not align to produce a perfect result.
| Reality |
|---|
| Your Findings | Ho True | Ho False |
|---|---|---|
| Ho True | Correct | Type II error |
| Ho False | Type I error | Correct |
2.2.6 Equations
Equations are a necessary part of statistics texts! LaTeX equations are easily incorporated into R Markdown. While it is possible to memorize the code and write them manually, I use one of the many freely available LaTeX equation editors.
Consider this equation (in LaTeX language) for sums of squares total (used in teaching one-way ANOVA):
\[SS_{T}= \sum (x_{i}-\bar{x}_{grand})^{2}\]
I created it by first mapping it out the code at the online tool and then wrapping that code in double dollar signs.
$$SS_{T}= \sum (x_{i}-\bar{x}_{grand})^{2}$$The result is an equation that appears, centered, on its own row in the text. When the LaTeX equation is wrapped in single dollar signs it will appear in the row. This is often the case when we present statistical output. Consider this example of the results of an F statistic. Results indicated a significant effect of the IV on the: DV F (2, 87) = 13.566, p < .001, \(\eta^2\) = 0.238.
A LaTeX equation is imbedded in the F string to properly format the eta-squared and present it in the sentence.
The result is an equation that appears, centered, on its own row in the text. When the LaTeX equation is wrapped in single dollar signs it will appear in the row. This is often the case when we present statistical output. Consider this example of the results of an *F* statistic. Results indicated a significant effect of the IV on the: DV *F* (2, 87) = 13.566, *p* < .001, $\eta^2$ = 0.238. 2.2.7 Building and knitting
The build process was described in the From bookdown to GitHub Pages{#book1} chapter. Especially when the projects are statistically oriented, building a book can take some time. If you would like a quick check of a particular .rmd file consider a quick Knit. This is an easy way to check your work and make corrections.
2.2.8 References
We opened this lesson by examining the YAML matter. In it were three specifications that pointed to a references style sheet, a .bib file from Zotero, and an instruction to link references.
Also necessary for including references is to install the citr package. This will add tool to the “Addins” dropdown menu in the center, top of your screen.
#install.packages("citr")References can be added by
- Selecting “Addins” dropdown menu (top)
- Selecting “Insert Citation” from the dropdown menu
- Selecting one or more references that you would like to include
Throughout this I have been referencing the R Markdown Cookbook and Authoring Books with R Markdown (Xie et al., 2021; Xie, 2021). I can select them both in a single list and R Markdown will format them properly
If I wish to reference an a work by the author’s name, say, Navarro (2020) I can add a dash in front of the reference and only the date will appear in the rendered book.
A reference list will appear at the end of the chapter and an entire reference list will appear at the end of the book. For this reason, you may wish to conclude the last chapter with an unnumbered chapter heading (in my case a single hashtagged heading, written in ALLCAPS, with the number suppressed).
Throughout this I have been referencing the R Markdown Cookbook and Authoring Books with R Markdown [@xie_authoring_2021; @xie_r_2021].

If I wish to reference an a work by the author's name, say, Navarro [-@navarro_book_2020] I can add a dash in front of the reference and only the date will appear in the rendered book.
2.2.9 How did you do that?
I’ve been doing this for just long enough to still be learning and updating, but also long enough to not recognize when something might be tricky for others.
If you have processes that are more efficient or effective than mine, I invite you to send an e-mail with your solutions.
If you see that I have done something that is unfamiliar to you, please let me know and I will consider adding another section to this perpetually-in-progress project.